How to Make or Break a Country
How to Make or Break a Country
Why are borders even important?
Geographical elements throughout history have had significant influence on the way people behave. Among many natural and human-invented geographical concepts, country borders have evolved to become not only geographical figures, but also political creatures. This makes them likely to bring crucial consequences in domestic and international administrations, all around the world. Although most of the leading experts in this field are currently in a debate about whether state borders are becoming obsolete or even more important in the age of globalization, current state of affairs implies that this topic is becoming even more significant than throughout history.
Using two datasets that in some manner collect information of the important political, economical and social events across the world, this study is trying to showcase the important border changes that occurred in the period after 1979 and the types of events that preceded them.
Even though this may not seem obvious from every day newspapers and TV programs, over the last couple of decades the number of nations on our planet has fluctuated considerably, from 167 widely recognized sovereign states in the 1970s to 195 in this decade. While some nations have unified, the noticeable rise in the number of countries is a product of the separation of pre-existing states. It is important to observe all of the changes that have appeared in these regions in order to better understand the tensions that are now rising in some new localities.
The information shown in our further analysis is primarily based on the data collected as a part of the GDELT (The Global Database of Events, Language, and Tone) project. The idea of this project was to collect the information about important people, locations, organizations, events etc. impacting the public scene from numerous media outlets in over 1000 languages from across every country on the planet. Its historical archives stretch back to January 1, 1979 and update every 15 minutes.
Additionally, the UCDP External Support Dataset was used to display some of the important international cooperation relations that come to light in the events of border changing. This dataset provides information on the existence, type, and provider of external support for all parties, on an annual basis, between 1975 and 2009.
In the end, none of the datasets offered information about the types and years of border changes throughout the world, so the information from Wikipedia was used to narrow down the observed events in both datasets to only those countries who actually went through some kind of change in territorial integrity. Articles from Wikipedia were also used to help in the process of recognizing the types of border changes.
Border changes from 1979 to 2017
The map below is supposed to illustrate all of the states that have emerged after some kind of border change after 1. January of 1979. By clicking on some of the “newly-created countries” (the term newly-created might not be appropriate in all of the cases, since some of these countries existed in some point in history, but were part of a unification or occupied for significant periods of time which ended after 1979) you can see the basic information about the selected country. For each country, the popup balloon shows the official new name of the country, the year in which the country emerged and the countries that existed on that territory before border change occurred. Countries are colored according to the type of border change that happened on that territory.
Types of border changes were classified according to the situations that resulted in the alterations of the territorial integrity into:
-
Communist is used to represent the countries that emerged as a result of decomposition of large socialist/communist countries.
-
Decolonization is used to represent the countries that emerged as a result of the last steps of decolonization.
-
Breakaway is used to represent the states that have declared their independence, but are not internationally recognized as sovereign.
-
Separation is used to represent the countries that emerged as a result of political or military conflict, or because they were freed from occupation.
-
Unification is used to represent the countries that emerged as a result of a unification of other previously existing countries.
Some of the countries had more than one border change in the observed period, so they belong to several types, which was marked by separate color in this map. There are also short explanations of the events that led to the independence of countries or their current conditions available at the end of each popup balloon. Even though this map provides an extensive overview of border changes across the world it is important to note that some of the breakaway states could not be represented since they are not considered to be even autonomous regions in their “parent” countries, so their borders are not precisely defined.
Distribution of events in the affected areas
After observing the countries that underwent a border change, it is important to understand all of the public events that preceded and accompanied alterations in territorial integrity. The radar chart below is used to showcase the distribution of the event types in different types of border changes. Different types of border changes are demonstrated in different colors, while different event types are positioned along the circle border.
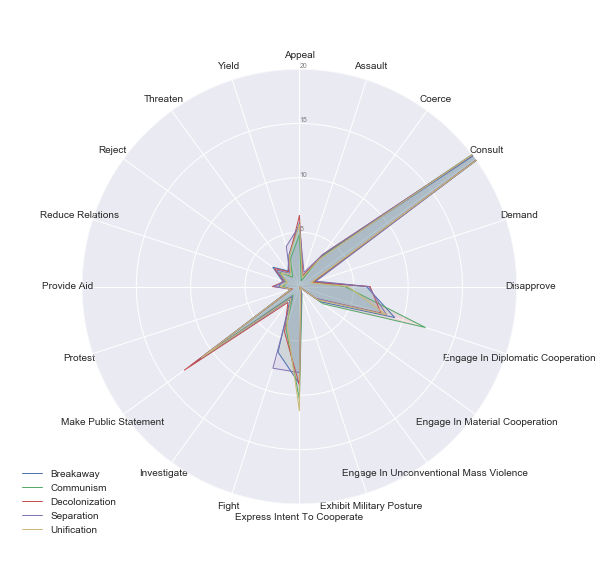
There are 20 types of events that can occur in the observed countries and they can have different meaning and positive or negative implications. These event types are: Appeal, Assault, Coerce, Consult, Demand, Disapprove, Engage in Diplomatic Cooperation, Engage in Material Cooperation, Engage in Unconventional Mass Violence, Exhibit Military Posture, Express Intent to Cooperate, Fight, Investigate, Make Public Statement, Protest, Provide Aid, Reduce Relations, Reject, Threaten and Yield. What immediately becomes obvious is the fact that the Consult event is the one that happens most often, regardless of the border change type. This event type is so widespread that it makes over 25% of all of the events that happened in the observed period, and makes the understanding of the distribution of other events harder to examine. Because of this fact, we created a new radar chart which again displays the distributions of the event types, just excluding the type Consult.
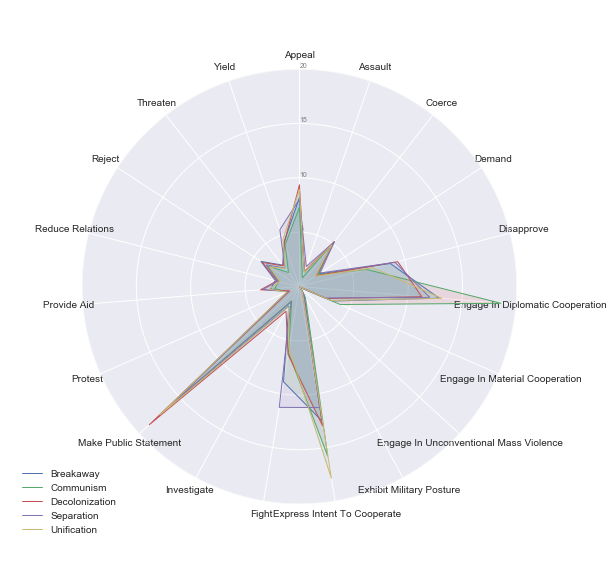
New version of the radar chart greatly facilitates the recognition of other important event types. Some other event types like Engage in Diplomatic Cooperation, Make Public Statement and Express Intent To Cooperate are again widespread regardless of the border change type. Contrary to these, the most prominent aggressive event type is Fight, which is significantly more common in the border changes that are results of separation or breakaway states. It is nice to see that even in the conditions of border changing, which could have a large effect on the nations that live in the affected regions, countries still gravitate toward more peaceful solutions like consulting and cooperation, rather than engaging in violent altercations. We can conclude that even though types of border changes have very different premises and are sometimes proclaimed with violence, events that precede them have similar distributions. The only potential indicator is the number of events of type Fight that occur in the area before the official border change takes place, since these are commonly followed by the separation or breakaway state which are usually more violent.
Since there are many types of events that occurred in the countries that faces border changes, it is important to analyze possible correlations that could appear between them. Following heatmap displays Pearson correlation coefficient between different types of events. Observed coefficient can demonstrate both positive and negative correlation (depending on whether the increase of one variable increases or decreases the other variable) and different strengths of the correlation (if the absolute value of the correlation is between 0 and 0.3 the correlation is considered small, between 0.3 and 0.5 – medium, and between 0.5 and 1 – strong). The stronger the hue of the square found on the intersection of two event types is, the stronger the correlation is.
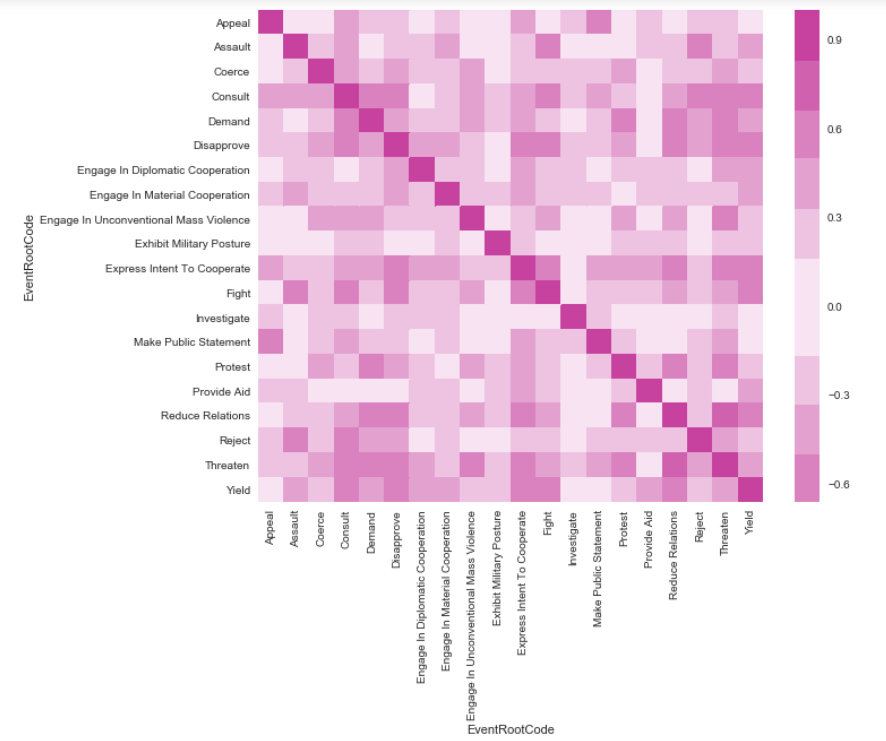
Even though many of the event types are completely uncorrelated, some medium and strong correlations can also be observed. The event type Consult is correlated with many other event types, which was likely since it was previously concluded that this is the most common one in the events distribution, so it can happen simultaneously with many other event types. The fact that the strong hue can be observed in the example of correlation of the event type Threaten with event types Demand and Disapprove, can be explained by the fact that many of the events of threatening are accompanied either by the events of demand or disapproval. That stated, it is important to once again state that correlation does not imply causation, since many of the same types could be caused by some external condition that is not represented in the data.
Enemy of my enemy is my friend
As can be seen from previous analysis, many different types of global events accompanied the process of border changing. In order to gain a better perspective of all of the external factors that in some capacity influenced the countries that underwent border changes, it is important to understand the international relations they had in the period of the border changing. Because it would be difficult to make a comparison of all of the relations between almost 200 countries in the world, it is better to concentrate on specific regions, which will be used as an examples for some of the global phenomena. Considering those limitations, next part of the analysis is focused on the Balkan region, which was strongly affected by the dissolution of the socialist country of Yugoslavia. Yugoslavia first came into existence after First World War, and consisted of six republics that all became independent countries in the period from 1991 to 2006. The countries did not separate without tensions, and most of them resulted in the armed conflicts of the included nations. The map below is showing the support countries received throughout that period, from the countries involved or just observing the conflicts. The displayed country, which is receiving support from others can be chosen in the upper left corner. Afterwards, the exact year in which the support was registered can be selected, in order to provide the overview of changes in support that occur over time. Each of the countries that provide support are colored and can be clicked which activates the popup balloon that contains relevant information about the support. There were no registered support missions for Slovenia and Montenegro in the observed period, so the only countries that are presented are Serbia, Macedonia, Croatia and Bosnia and Herzegovina.
From the map it can be observed that the support was not just limited to the international relations of cooperation, but also that many of the help missions were based on similarities in religion within the population of two countries. Most of the foreign assistance happened in the period from 1992 to 1995 which was marked with the so called “Yugoslav Wars”. It is also important to mention that the dissolution of Yugoslavia still did not end, since there are still many separatist movements across regions of the mentioned countries.
Come closer
Because none of the overall distributions of events have shown any significant differences between types of border changes, further analysis is used to “zoom” in the problem for a bit, and only observe the countries in Africa. This continent was chosen because almost all of the observed types of border changes are present (all except communism) in some of the countries from Africa. Only seven types of events were observed in the analysis, in order to facilitate the understanding of presented graphs. These events were chosen to represent three groups: positive verbal events (Express Intent to Cooperate), negative verbal events (Appeal, Disapprove, Threaten) and violent events (Assault, Fight, Engage in Unconventional Mass Violence).
Firstly, Zimbabwe was observed as an example of decolonization. Period from 1979 to 1981 was observed, since this is the period in which the country gained international recognition as an inYdependent state.
From the graph, it is visible that the change of borders was preceded by many violent events, especially fights. After the period of violence, came the period of international negotiations, which can be noticed in the growing amount of events that promote intentions to cooperate. Unfortunately, the official change of border was not followed by the period of peace and prosperity, but again in the rising amount of violence that might have been caused by unrest known as Gukurahundi.
On the other hand Somalia, faced the breakaway state situation when Somaliland proclaimed independence in unilaterally in 1991. The period that is observed for this country is from 1986 to 1993.
The events registered in Somalia in the 1980s are showing that this was the period of mixed violent and cooperative efforts in the country. In 1991 and following years the Somaliland area declared independence and the county went into a civil war, which can be observed by the rise of the events of fighting (in 1993 over three times larger amount than in the previous period) and in the rise of the expressions of intent to cooperate (in 1993 over 5 times larger amount than in the previous period).
In another example, in 1990 Namibia gained independence from years of occupation by German and South African forces. This means that the country had type of border change called separation. The observed period for this country was from 1985 until 1992.
The graph shows that during the whole period the country mostly relied on verbal expressions to display its appeals or intentions to cooperate. In 1988, South Africa agreed to allow Namibia’s transition to independence, and this period of change can be explain significant rise in the number of expressed intentions for cooperation, as Namibia needed to reestablish its sovereignty, probably with help of other neighboring countries. In 1989 and 1990 many peace keeping forces were deployed to supervise elections and military withdrawals from Namibia. Unfortunately, the data suggests that even with all of these efforts, number of fights that occurred in 1989 jumped over 5 times compared to previous years.
In the end, the only example of unification in Africa was Senegambia, loose confederation consisted of Senegal and Gambia. It was founded in 1982, but dissolved in 1989 after political conflicts between the countries. The unification will be observed through the events present in Senegal, in the period from 1985 to 1992.
The fact that unifications, as one of the most peaceful types of border changes, usually do not involve that many violent events is obvious in the example of Senegal. Most of the events in Senegal in the examined period are verbal and largely devoted to expressing intents to cooperate. The only period of fighting events occurs in 1989, which is the year in which Senegal dissolved the confederation. In the examples of African countries, it can be observed that most of the border changing cases are accompanied by at least some amount of violent events. Luckily, acts of unconventional mass violence and assault are very rare, and the summed amount of verbal events is still larger than the amount of violent altercations. Again, not surprisingly, it can be concluded that the unifications are followed by the lowest amount of fighting and violence.
The end, or not?
In the end of the analysis, with the help of several classification algorithms some of the countries with history of separation or unification movements were analyzed, according to the number of events by type that occurred in them in previous period and the overall tone of these events. The way the algorithm suggested borders of these countries will change in future can be observed in the following table.
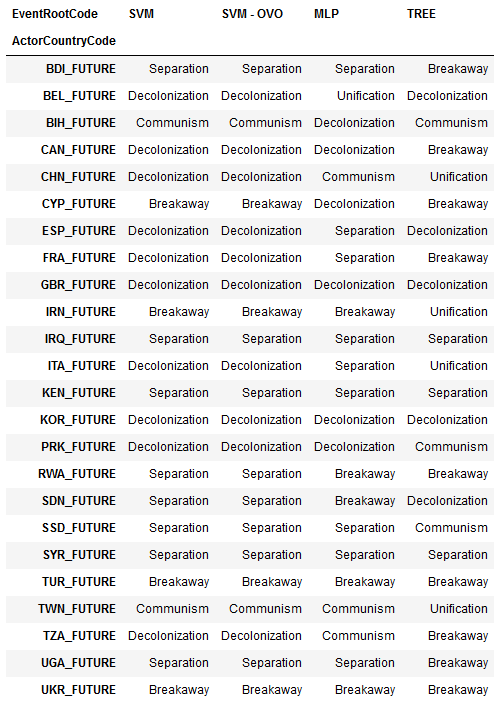
Maybe we will all witness some new changes in the country borders in the following years. The only hope that remains is that they will be followed by more intentions for cooperation, and less violent outings.